Get More Out Of Google Analytics – 4 Gems You Might Be Missing

Google Analytics is a super-powerful tool and most people only scratch the surface. Here’s a few cool features to check out that you may not have discovered yet.
Do You Need A Better Mobile Strategy?
 Talk of responsive design, mobile apps, mobile plugins etc are all the buzz right now, but what will be the best strategy for you? If your site is not responsive, will it be worth investing in a responsive design, or should you just use a WordPress plugin to cover your bases?
Well one way to find out is to look at the mobile report within Analytics to see how many people are even trying to access your site from a mobile device. You’ll find this report under the Audience tab on the left. Click on Overview and you’ll see a simple breakdown of how many visits came via desktop vs mobile devices. Currently Analytics doesn’t distinguish between tablets and smartphones – both are ‘mobile’.
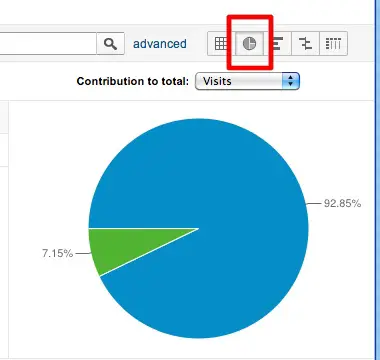
Click the pie chart icon on the right to get a nice visualization of what percentage of visitors use a mobile device.
 Once you click on Devices on the left then you will see stats on specific devices which is where you could separate iPad users from smartphone uses.
There’s no hard and fast rule about what percentage becomes important enough for you to accommodate, but it will allow you to start tracking this data and make an informed decision about your mobile strategy.
Performance and Page Speed
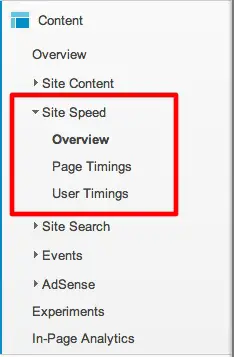 The time it takes pages on your website to load is now a factor in search engine optimization, so Analytics has added some functionality that lets you know how your site is doing. You’ll find this under Content, then Site Speed in the left column. It will let you know how long pages take to load and you can get this info cross-referenced by browser, location and more.
Real Time Reports Are Out of Beta
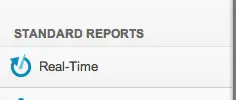 Real time reporting was a beta feature for quite a while, but now it’s been moved into the main part of Analytics. It has its own Real Time tab at the top of the left column. You can see live visitor activity as it happens – how many people are on the site currently, how they arrived, what they are looking at and more. This could be useful for getting fast results on the effects of a promotional campaign, email blast or any other timely event.
In-Page Analytics
This is like a mini heatmap feature. It provides you with a visual guide to what gets clicked on your site. Right out of the box it cannot distinguish between two links going to the same page – you need to implement a little extra tracking code for that. So it’s not perfect but definitely handy. It gives you a good representation of where “the fold” is so that you could optimize the placement of your calls to action and other important info. Find it under the Content tab.