What’s Making Our Websites Slow? We Are!

Table of Contents
This is the blog post that accompanies a talk I gave at WordCamp Seattle in 2019. You can see the slides here. The video of the talk is up on WordPress.tv
Additionally, the HTTP Archive Web Almanac was published around the same time so I’ve also interspersed some of the insights from that report since they dovetail really nicely.
Providing excellent context for this post, the CMS chapter shows how sites built with a Content Management System (and WordPress sites comprise almost 75% of those in the report) tend to:
- be more bloated with heavier page weights
- use more 3rd party resources
- use heavier images
Additionally it reported that WordPress sites tend to have slower performance metrics.
Now this is not really the fault of WordPress itself, it’s really due to what we site owners have done.
While it’s possible to build bloated pages and use techniques to make them seem fast, that shouldn’t be the goal. Let’s just build lighter pages to begin with!
I’ve been working in customer support for a premium caching plugin (WP Rocket) for several years now. I’ve seen a lot of websites and helped a lot of customers. Every day, many times a day, in our ticket queue, we receive some version of this question:
“Why isn’t my site faster?”
Depending on the site there may be many answers to this question. However the answer is almost never anything to do with caching.
A caching plugin, nor any one optimization technique can fix all performance issues. In fact, as site owners we can be our own worst enemy when it comes to speed, due to all the content we’ve put on our pages.
We have to take some responsibility for the sites we’re building and realize the direct impact on speed that we are having.
To illustrate, let’s have a brief look at the journey of a WordPress site owner building their site.
First, you choose a host. If you’ve read anything about performance you know this is a crucial choice and hopefully you choose a good one.
Then, you install WordPress, followed by a theme. Maybe you even pick a fast one like Astra or GeneratePress , and add some basic content.
At this point, performance-wise, your site is the equivalent of this heart-healthy bran muffin:

It’s not fancy, but it’s good for you.
The problem is most people don’t want the healthy bran muffin. We want something more flavorful, more enticing.
Let’s add some flavor!
So we start fleshing out the pages on our site. WordPress offers us tons of plugins to choose from, and our theme may offer bells and whistles as well.
Maybe we add a slider to showcase images representing different elements of our business. Perhaps an Instagram widget so people can follow us socially. How about a Google Map so people can find our business? And what about a demo video of our product. Etc etc.
After doing all of that, our site is the equivalent of this glazed donut cheeseburger:

Some of you may think that looks appetizing, but clearly it’s a heart attack waiting to happen. In terms of performance our site is now bloated and slow.
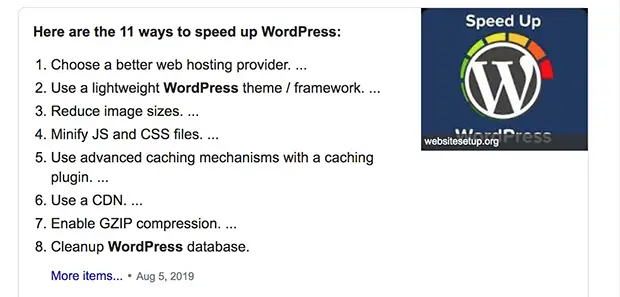
So then we take to Google and search for something like “how to speed up WordPress.” There’s a ton of articles on this subject which provide lists of various technical optimizations we can do – caching, minification, GZIP compression etc etc.
These are all good things to do, but even after implementing them all, our site is only moderately less unhealthy:

Perhaps not as bad as the glazed donut cheeseburger, but clearly less than ideal.
And you’re left wondering what went wrong… “but, I chose a fast theme?!”
While performance can be incredibly complex, the common thread in this case, and many of the cases in our ticket queue, is the site owner – you and me.
With our own content choices we tanked the performance of our site and gave it an internet heart attack.
So what’s the solution when you’ve done all that you know how to do and your site is still slow?
Change our mindset
First, we need to change the way we think about performance and our role in it. Good performance doesn’t just happen to websites. As site owners we have to work at it and prioritize it.
Optimizations like caching, minification etc, only mitigate the negative impact of what we’ve created. These should be the final touch that we add to our website – the icing on the cake. But we have to make a better cake.
Yes, performance can be highly technical, but there’s also a lot that’s under our control.
I’ll share what I’ve seen to be the most common mistakes site owners are making, based on my experiences in customer support.
Characteristics of a fast page
There are many metrics we can use to define speed. But to keep things simple, these are the basic characteristics that we’re going for. A fast page is:
Fast by default: before optimizations
We want our pages to perform well even without caching and optimizations. The goal is to start from a good baseline. Not all pages on your site, like a checkout page, can be cached, so they have to perform decently without any tricks.
Visible and usable quickly
When a page is visible quickly visitors will feel that it’s loading fast. When it’s usable quickly it means they can click on something and it will respond without a noticeable delay.
Mobile-friendly: works well under poor conditions
Mobile conditions can be unpredictable. Even if most visitors are usually on a 4G connection, anyone can be in an area of bad reception, for example, and suddenly be on the equivalent of a 3G connection. Optimizing our sites to be fast on mobile will mean they’ll positively fly on desktop.
If you stick to the principles I’m going to show you, your pages should be in a good place, even before you’ve applied optimizations.
What are the ingredients of a web page?
For context, here’s a quick review of the components of a web page. We’ll see that not all are created equal – some are more expensive for performance than others.
These are the primary components of web pages:
- HTML
This provides the foundation, the structure of your site. It normally contributes the least to page weight. - CSS
Controls the styling and design of the site – colors etc. - JavaScript
This is mostly used for interactive elements – sliders, online chats, animations etc - Images
- Fonts
e.g. Google Fonts, Typekit etc - Video and other media
- External / 3rd party content.
Your files and content will mostly be hosted from your own domain, but external or 3rd party content is when files are hosted from another domain that you do not own. A common example would be Google Analytics or Google Fonts which are hosted on domains controlled by Google. Ads provided from an external agency (Mediavine, Google Ads etc) are another common example of external/3rd party content.
3 enemies of speed
Just like food, there are some ingredients that are healthier for your site than others. The most important ones to pay attention to are:
- Page size (the total of all the components)
- JavaScript
- Third party content
I’ll explain exactly why we need to watch these, how they impact performance and how to find them on your site.
How much is too much?
There can be multiple variables here, so these should be considered as rough guidelines.
Assuming you have a good host, and that your mobile users are generally on fast mobile connections, here are some guidelines:
- Total page size: 1 MB or less
- JavaScript is the most expensive ingredient on your page. Less than 150KB would be ideal.
- Simple 3rd party content: analytics, fonts etc: 25% or less
- 3rd party ads, social widgets: as little as possible!
If you’re on a shared hosting plan where your server is likely under-powered, or you know that your mobile users are mostly on slow connections or old devices, you will have to be more strict. The better the hardware (both server and user devices), the more you can get away with with less performance impact.
Extra credit: Performance budgeting.
If you want to get deeper into managing your page content, or maybe you work as part of a team, look into performance budgeting tools:
Why have I highlighted these 3 particular areas as problematic?
Page size: mo’ data, mo’ problems
“Roughly 10% of the pages we’re pushing at the unsuspecting public are in excess of 6 MB and contain 179 requests. This is, frankly, terrible. …
Yes, you can build large robust pages that feel fast… to some users. But you should care about page bloat in terms of how it affects all your users, especially mobile-only users who deal with bandwidth constraints or data limits.”
https://almanac.httparchive.org/en/2019/page-weight
This one is relatively simple. All the data on your page – that is all the components – have to be downloaded from a server over the internet to your visitor’s device. The more data your page requires, the longer it will take to download.

Imagine a funnel. At the top is the data going in from your server and at the bottom is the visitor’s browser. Quite simply, the more data you put in the funnel, the longer it will take.
On a mobile device it’s the same, but the funnel is narrower, so it will take even longer.
The download time can be affected by other factors, like the distance from the server, the speed of the visitor’s internet connection, the processing power of their device and more. You can’t control those factors, so making your page as small as possible is the best practice.
The problem with JavaScript
“JavaScript is the most costly resource we send to browsers; having to be downloaded, parsed, compiled, and finally executed.”
https://almanac.httparchive.org/en/2019/javascript
JavaScript is a type of code used to make interactive elements on a web page: things that move, animate or are dynamic in some way. That can make websites interesting and do some cool things but there is a trade-off to that.

When you add JavaScript to your website, it’s like buying something from IKEA.
Let’s say you buy a coffee table. You bring it home unassembled in a flat box, which is compact and takes up relatively little space.
But then you have to spend time to open the box, read the instructions and actually build the table.
It takes time to read, understand and act upon the instructions. And once the item is built it takes up more space than it did in the flat box. Even if the box is small, the instructions could be tricky and it could take a while to build.
JavaScript is similar. It’s downloaded from the server to your visitor’s “home” (browser) in a compressed format, but then the browser has to unbox that, read it (parsing) and execute the code (build it).
Not only does all this take time and computing power, but on top of that, while the browser is figuring out the JavaScript, it’s not doing anything else.
This means your visitor might see some content on the page, but when they try clicking on it, the page doesn’t respond, frustrating the visitor and making them feel the site is slow.
Why is 3rd party content bad?
“At the median, 89% more third-party code is used than first-party code authored by the developer for both mobile and desktop. This clearly shows that third-party code can be one of the biggest contributors to bloat.”
ref: https://almanac.httparchive.org/en/2019/javascript
There are a few reasons why 3rd party content can have a negative impact:
- You can’t control those other servers so you can’t optimize the content
- Every domain requires connection time
- If one request fails it has the ability to break the site
Some 3rd party content is OK, like fonts or analytics – those are quite static and in moderate amounts won’t be too harmful.

But some 3rd party content can wreak havoc.
Imagine you invite a few friends over for a quiet, sophisticated dinner party. Let’s say one of them decides to invite their cousin, who is perhaps not as quiet and sophisticated. The cousin brings a friend,who is bad news, and who proceeds to invite some other homies. They bring beer kegs. Pretty soon you have a bunch of drunken frat boy types causing chaos and trashing your house, and you don’t even know any of them.
This is what bad 3rd party content, most notably ads and social widgets, can do to your site. You think you are just inserting one little snippet of JavaScript into your site, but that proceeds to launch chains of requests to yet more external servers, pulling in more and more files, wrecking performance.
You can see this clearly using a tool like Request Map. Compare the 2 images below and pay attention to 2 things:
- Lines = file requests
- Different colored circles = different domains
In the first one below you can see relatively few colors – that’s because most of the content is coming from the main domain. And you can see one main hub from where the lines are originating – that’s the main domain. The lines are the same color so most of the requests are hosted on the main domain. This is a healthy site.

In the second you can see many different colored circles, representing many different domains. And you can see multiple hubs from which yet more file requests are spawned. This is a site with ads.

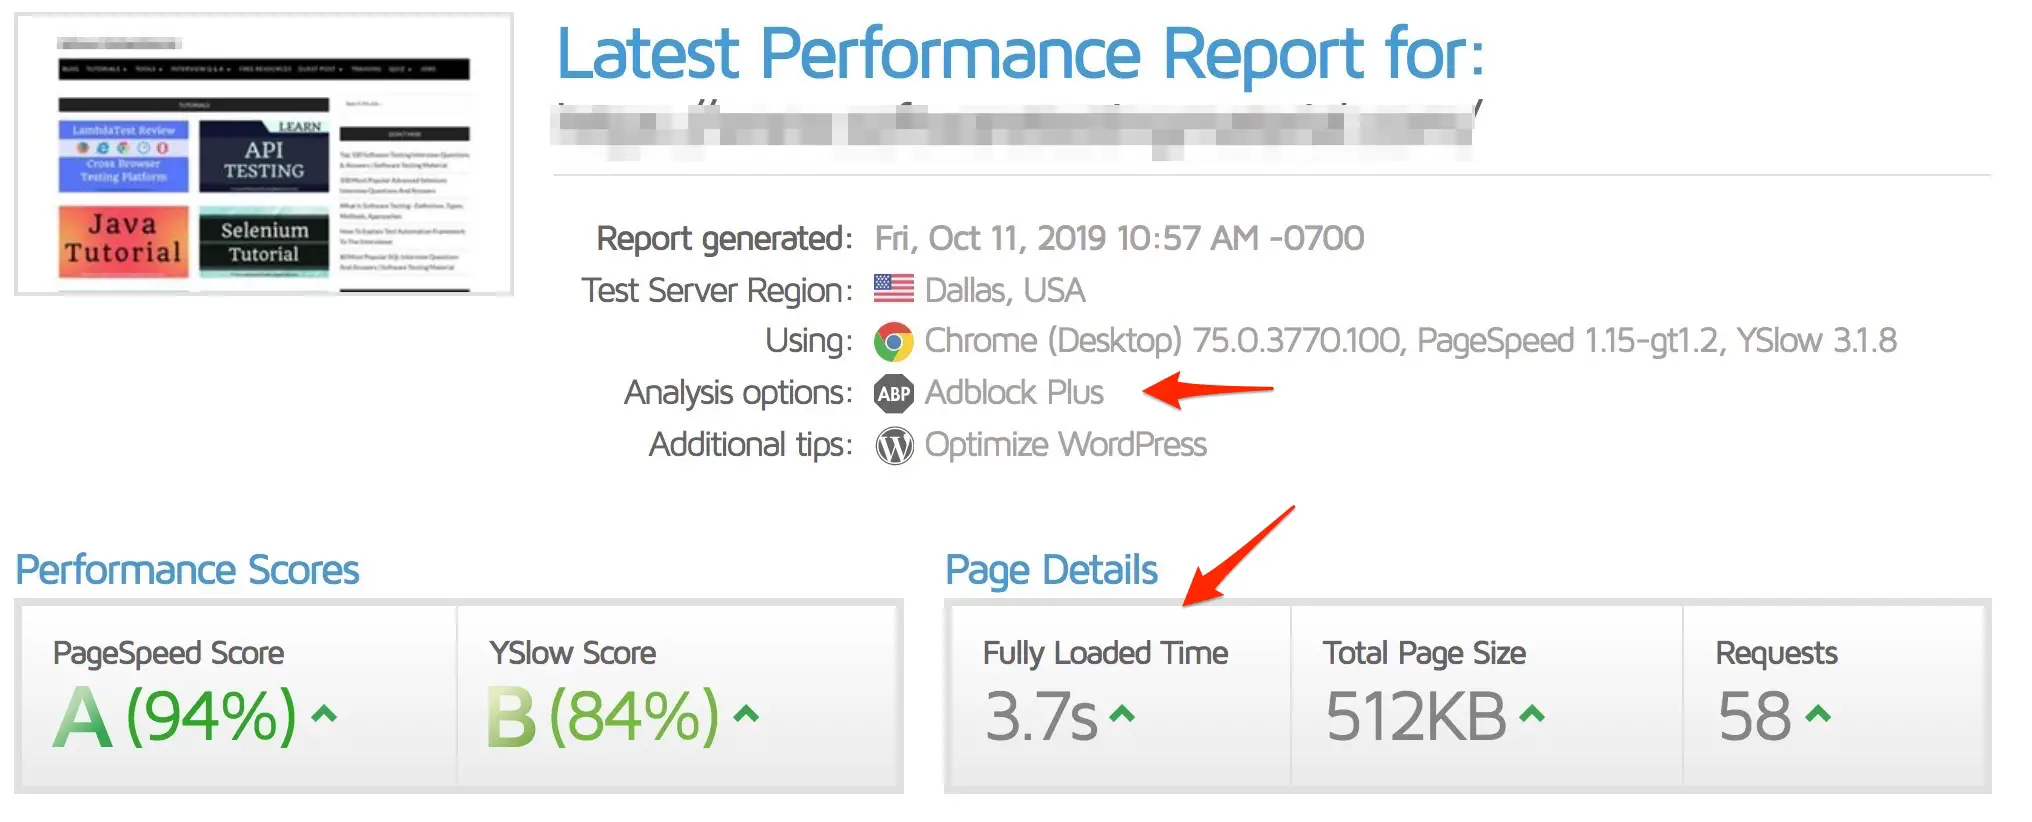
Running a GT Metrix report with and without Adblock (which you can access with a free account) also shows the contrast and how much ads are contributing to page size, requests and load time.

Not only are they bad for performance but this type of content usually arrives with tracking pixels and other things that are not privacy friendly. So there’s many layers of why this stuff is bad.
Everything takes longer on mobile
The negative impact of all these things are amplified on mobile.
- Mobile devices are often using slower connections
- They have less CPU (processing power), especially mid-range devices. Keep in mind that not everyone has the latest iPhone.
- Unpredictable conditions – you may normally get a 4G connection but you can go into an area where you’re on the equivalent of a 3G or worse.
So your 3MB page, with a 5 image slider at the top, might work tolerably, nicely even, on your MacBook Pro over your Cable internet at home. But for a user on a slower connection, maybe on a shared Starbucks Wifi, or a mobile user on a slow 4G, or god forbid (!), 3G connection and a middle-of-the-road device with little processing power, that could grind to a halt for them.
So if we consider mobile from the beginning and try to make our sites fast there, they will automatically be even faster on desktop.
Find out the current state of your site
So now you know what you’re looking for, here’s how to find out the current state of your page.
You can use free speed testing tools to easily check the important stats for your page.
What’s my page size?
The page size is easy to spot on a GT Metrix report:

Remember that 1MB or less is ideal. The higher you go above that, the more performance will typically decrease, especially on mobile devices.
How much JavaScript do I have?
On GT Metrix, click on the Waterfall tab, then filter the results by clicking the JS button:
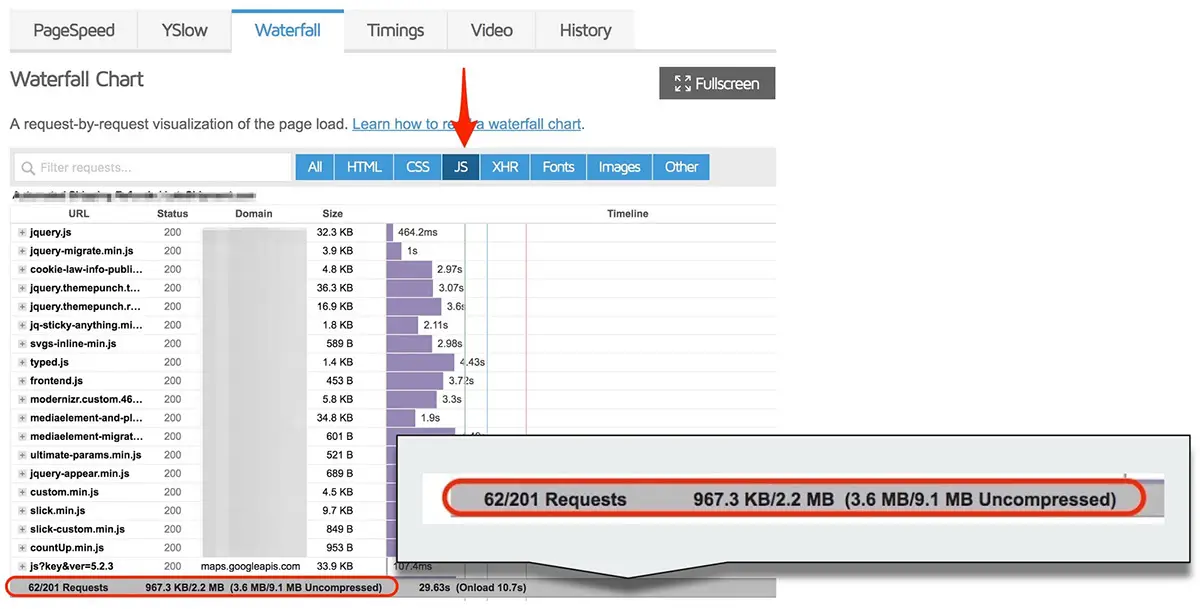
At the bottom left you’ll see the number of JavaScript requests (files) compared to the total number of requests on the site. In this example there’s 62 JS requests out of a total of 201.
To the right of that you’ll see the total file size of those requests. In this case the JavaScript accounts for 967.3KB, out of the page’s total size of 2.2MB. This is the compressed size – meaning when it’s transferred with GZIP. To the right is the uncompressed size – how much it is when the browser has “taken it out of the box”. Here it balloons into 3.6MB.
How much 3rd party content is there?
There’s a few ways to check for this. I think Pingdom has the nicest looking breakdown. After running a test, scroll down the page until you get to the Content size by domain section:
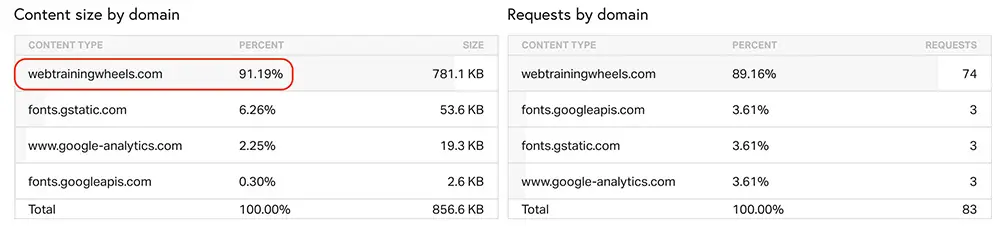
Here you can see that most of the content, 91% is hosted on my own domain. That’s healthy, it means less than 10% is external.
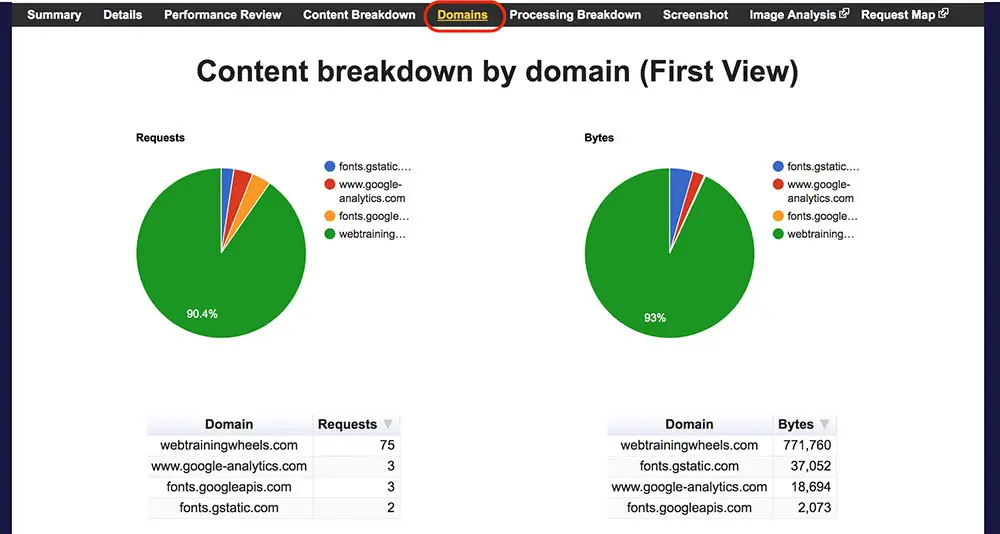
In Webpagetest, click on the Domains tab to see a nice pie chart breakdown:
So now you know what’s on your page, where did it all come from?
This is where we come in!
We’ve added all this stuff through the theme options we’ve selected, the plugins we’ve added and the content we’ve uploaded into our pages in the WordPress editor. Now we can dig a bit deeper to find where the biggest problems are.
Find the problem areas
Now we’re going to look at how to find some low hanging fruit – some clear problem areas we can improve right away.
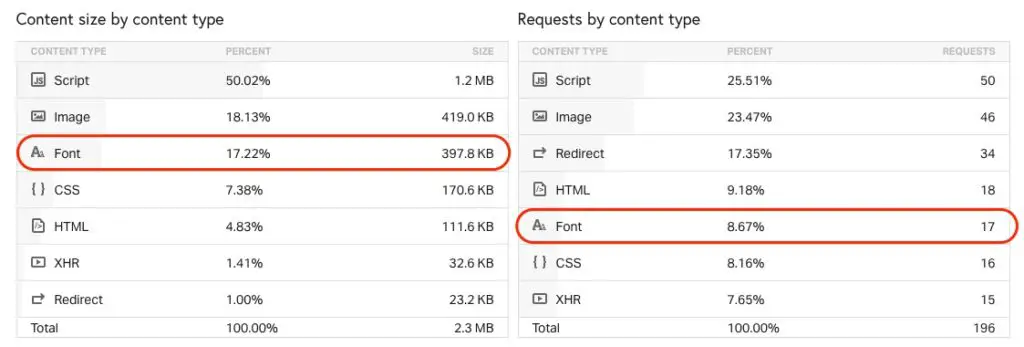
In Pingdom, the Content size by content type report is really helpful. You can see right away which type of content is contributing the most to your page size.
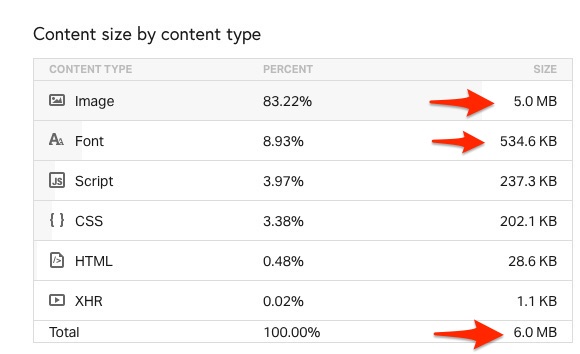
In this example, the total page size is 6 MB, which is 6X larger than our goal!
Images are the biggest problem, contributing 5 MB. That means there’s likely some which haven’t been sized correctly or compressed.
And fonts are adding another 534 KB.
Find the largest files
Turn off optimization plugins for this step since they will change the file paths and make it harder to find the source.
In GT Metrix, click on the Waterfall tab, then click on the Size column twice to sort with the biggest files at the top.
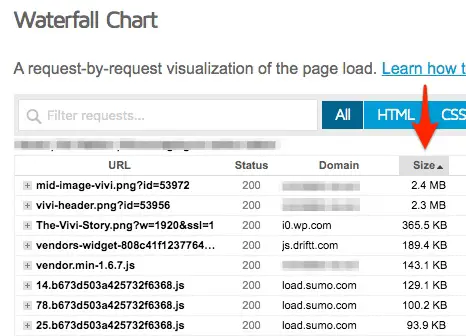
As is the case in this example, often the biggest files will be images which need to be sized correctly and optimized.
By mousing over any line in the list, you will see the full file path so there you can see if a certain file is loaded by a particular plugin.
You can also check the Domain column to see which external content is loading which files.
Find the worst JavaScript
Make sure you disable any caching/optimization plugin before running the following tests so that you can see the original file URLs.
I don’t recommend non-developers use PageSpeed for much because it can be confusing and hard to understand, but they do have a couple of useful sections.
One of them is: Reduce JavaScript execution time.
What this really means is: the JavaScript code on your site is running slowly and slowing down your page. This can be really useful in showing which specific plugins are adding slow JavaScript.
In the Reduce JavaScript execution time section you’ll find out which scripts are keeping your browser too busy and your site too slow. Make sure you click on it to expand it and see the specifics:
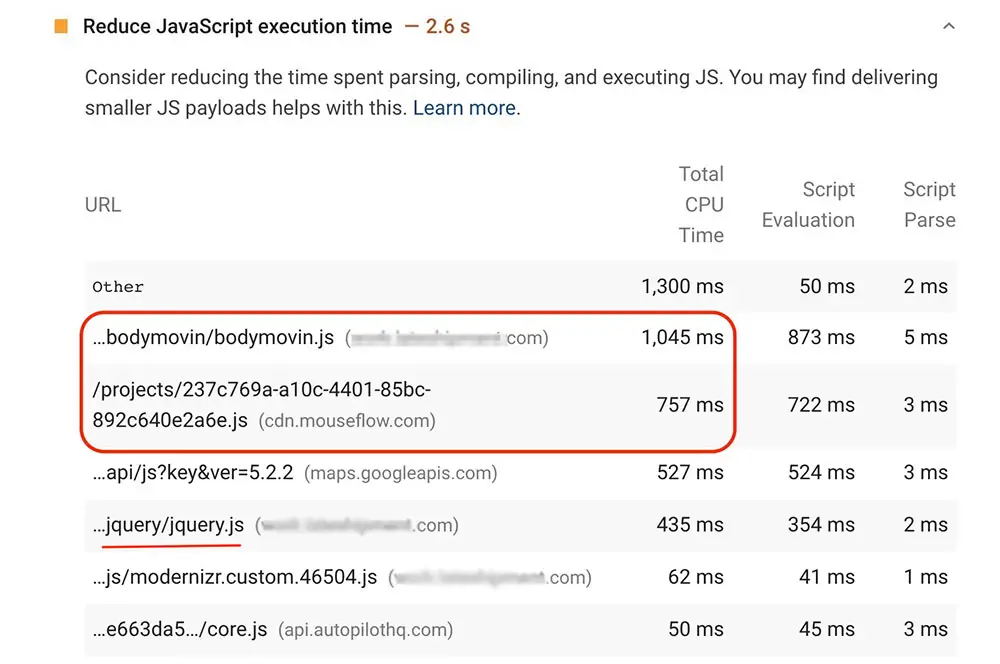
Check the Total CPU time column to find which scripts are taking up the most processing time. You can mouse over the filename to see the full file path.
Note: jquery.js will show up often because that file is used by many other JS components on your site. So you can’t really remove it without breaking other things.
Now you know what’s slowing things down, what do you do about it?
Since you didn’t write the code loaded by whichever theme/plugin is the culprit, you can’t fix it directly. The developer of the code would need to optimize the code itself (that’s who these reports are really made for).
But as the site owner you can choose to either remove this plugin from your site, find an alternative plugin, or if it’s crucial to keep, remove other elements from the page to mitigate the impact.
Minimize main-thread work is also related to JavaScript but it doesn’t give a non-developer anything useful to work with. Take note of the timing for benchmarking purposes and to see how it goes up or down as you add and remove components from your page, but that’s all.
JavaScript impact on mobile
Comparing the JavaScript results between mobile and desktop shows you how much more slowly JS executes on mobile and therefore how the impact is amplified:
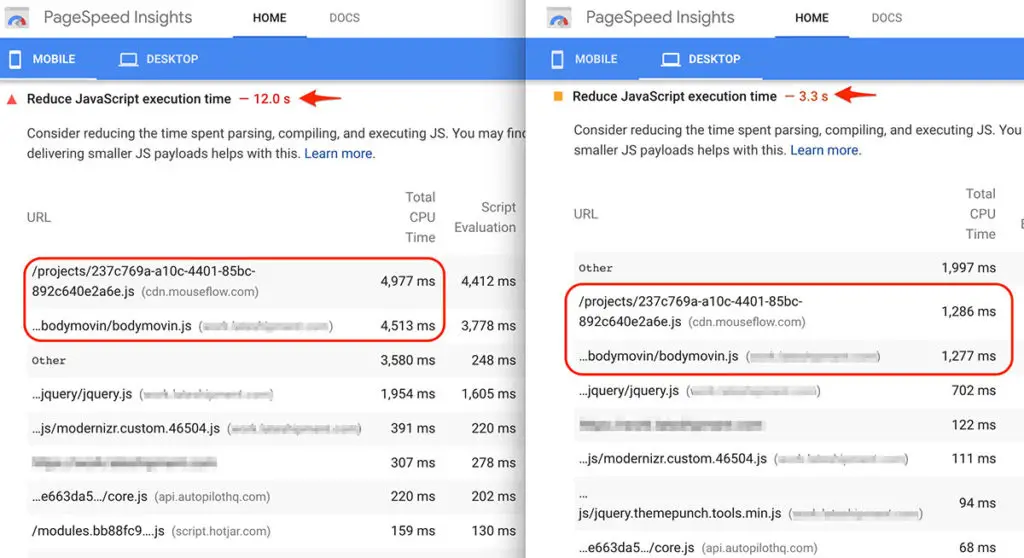
Here you can see that on the same site, with the same scripts running, the JavaScript execution time is about 4x longer on mobile.
That’s pretty normal. PageSpeed does use a 3G connection for its mobile tests, so it could be a worse scenario than some of your users will actually experience, but it’s possible that some of your users are experiencing this at least some of the time.
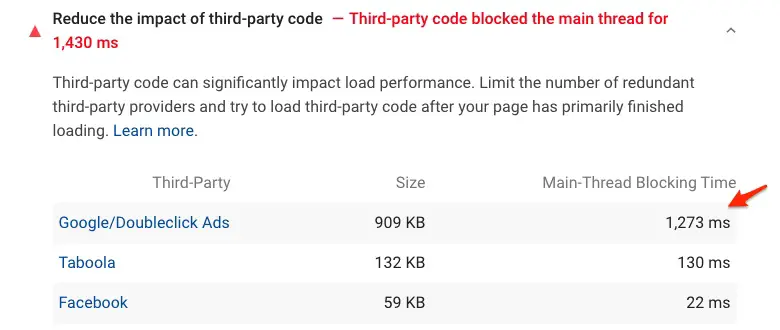
Find the 3rd party crashers
The 3rd party report in PageSpeed is useful to show a clear picture of the worst offenders here. Check the Main-Thread Blocking Time column to see which scripts take the longest to process:
Making speed-based decisions on your WordPress site
So how do we put this into practice in the everyday business of creating and managing our WordPress sites?
We have to consider that everything we add to our page will have a performance cost. If we want each page to be fast, we won’t be able to load up each one with every bell and whistle.
We’ll have to make some compromises, trade-offs and hard choices. It’s all a balance between adding the features we need, providing an enjoyable experience, and performance. Here are a few examples of the kinds of decisions you’ll make that directly impact performance.
Go easy on the ads
I know this is the primary monetization strategy for some sites so maybe you can’t realistically remove them all. But be sparing.
In the screenshot below, there are 4 ad blocks before I’ve even scrolled the page:

Many sites increasingly look like this, or worse, and it creates a really poor user experience which is likely to make people bounce from your site anyway.
Be more strategic with the placements and you’ll create a better experience, keeping people on your site longer, therefore with more opportunity to interact with your ads.
Try to work with high quality ad networks, or even better, have direct relationships with advertisers so you won’t be adding random code to your site sucking in ads that you can’t control.
Be selective with fonts
Some themes let you pick a different font for everything – from the title, to headings, to body text etc.
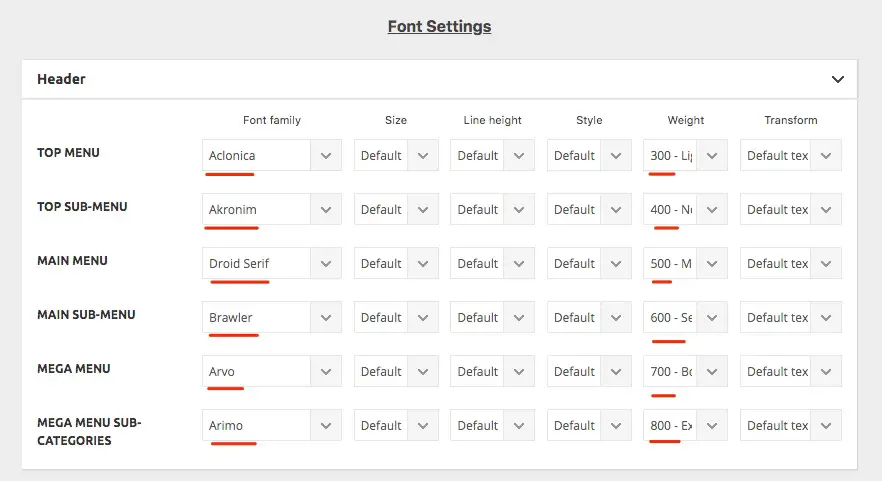
But just because we can choose a font for everything, we certainly shouldn’t! Just choose a couple of fonts and stick to those. Choosing multiple different weights and other variations will also add to the size and number of requests that need to be made.
You don’t want to end up with almost 400KB just of fonts:
Be choosy with sliders and carousels
Site owners often use sliders as a shortcut to making decisions about what to actually feature. In this example there are 3 sliders on the page:

And they’ve been loaded up with images, generating a total of 118 images and 15MB!
If you are using a slider or carousel, use a maximum of 3 images. The rest will not be seen by your audience in most cases.
Limit social widgets
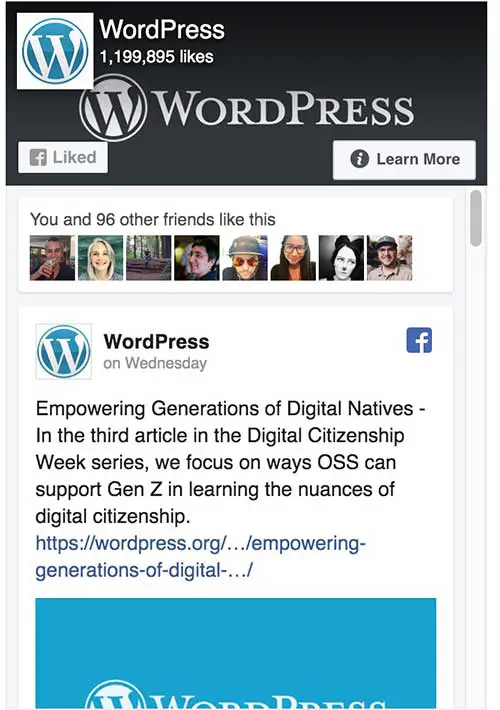
Social widgets are things like Facebook Like boxes, Instagram widgets which pull in pictures from your feed, Pinterest widgets showing your latest pins etc.
Simply adding a Facebook like box to page added 32 requests, over 400KB and 4 seconds of load time:
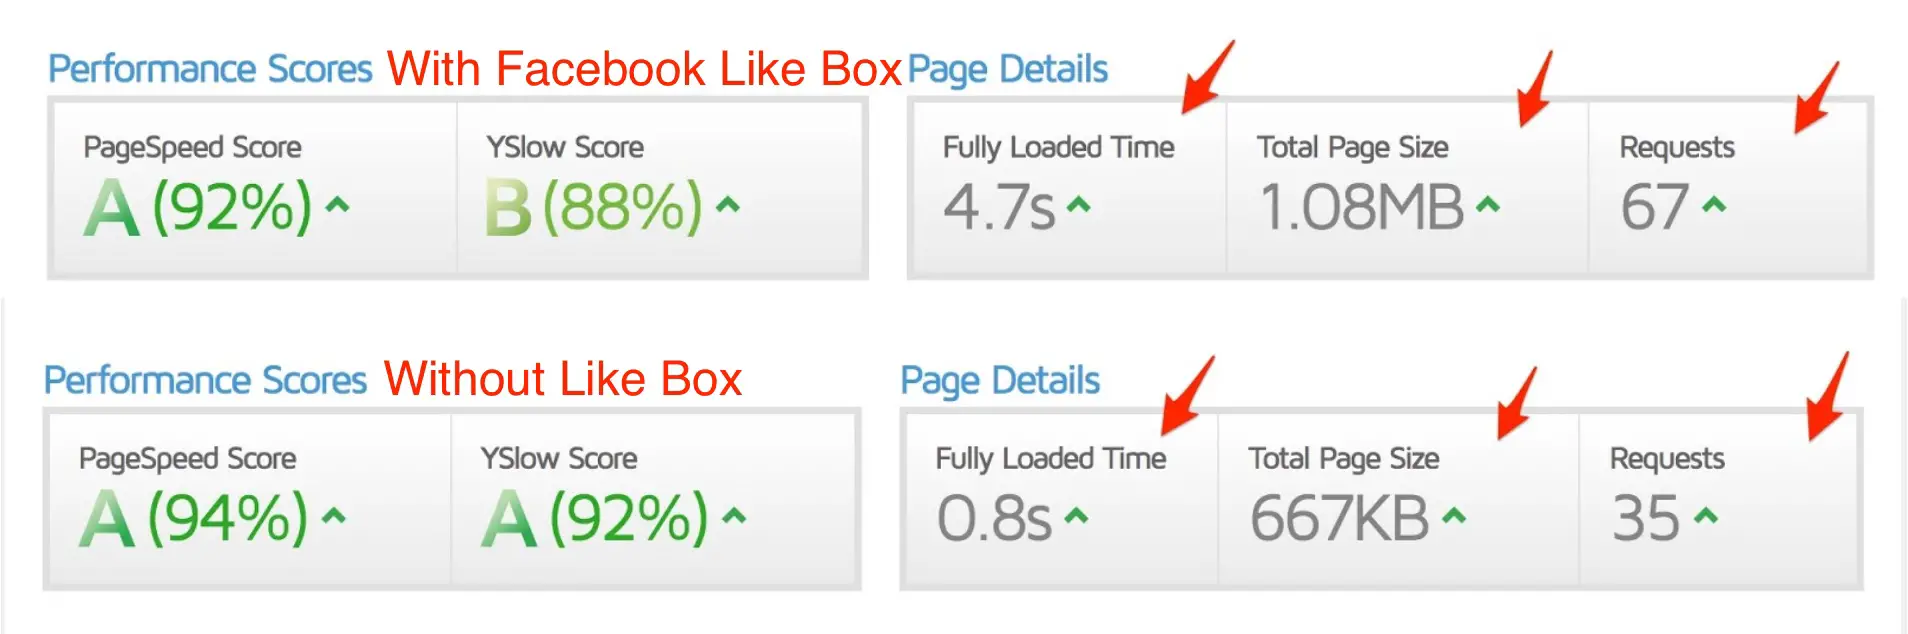
If you have to include them, limit the amount of content they are pulling in and don’t put them on every page if you can avoid it.
Do you need all those videos?
Every YouTube video will load 1MB of JavaScript on to your page.
That’s per video. So be picky, and even consider an alternate platform. For example, Vimeo’s embeds come with a little less baggage.
Our websites cost everyone
Most site owners are motivated to have a fast site for the benefits we, or our businesses personally get, such as:
- Better SEO and search engine rankings
- More conversions
- Better user experience (because it leads to the above 2 results)
But at the same time we also need to realize the cost of our sites to others:
- The time & attention of our visitors
- Data & bandwidth costs money – whatdoesmysitecost.com
- Our sites cost the environment with their carbon footprints – websitecarbon.com
Our planet is clearly in a climate emergency. Websites and the internet in general require electricity to operate. The more data our sites transfer and process, the more energy that requires. The heavier our pages are, the bigger our carbon footprint is.
As we keep hearing, WordPress sites comprise more than 30% of the web. As site owners, that means we do have the potential to make a big impact on the carbon footprint of the internet. This is a pretty empowering realization as it’s something we can easily do as individuals that will have an impact.
So for the sake of both our visitors to our sites and the planet at large, let’s build our sites to be as light and fast as possible!